
The recent Bank of Japan rate hike on July 31st, 2024, had a major impact on the USD-JPY “carry trade,” a long-established arbitrage strategy where funds are financed in JPY and invested in USD, capitalizing on respective interest rate differences. In fact, the rising yen has sparked speculation about the end of the carry trade all together. In today’s blog, I’ll discuss the impacts, risks, and opportunities surrounding the latest changes to Japanese monetary policy, and how market players can cope. For an even deeper dive into this topic, watch my newly released video.
Historical Lookback
If we take a historical look at the overnight rate set by the Bank of Japan, it started trending downwards from 6% in May 1991 to 0.5% in September 1995. Up until Oct 2008, the rate was largely kept at 0.5%, then was adjusted downward to 0.1% and finally adjusted downward to -0.1% in Jan 2016. The rate remained constant at that level until March 2024 when it was increased for the first time in 17 years, from -0.1% to 0.1%.
A Ripple Effect
The unexpected July 31st hike has moved the JPY rate to 0.25% and the result of that decision was a series of margin calls to fund losses related to carry trade positions that amounted to a market event in Japan which rippled through global financial markets for several days. On Aug 28th, the Deputy Governor of the Bank of Japan indicated that further rate increases might be on the table.
By contrast, on September 18th, the FOMC (Federal Open Market Committee) in the US are due to make their next determination on changes to the EFFR (Effective Fed Funds Rate), and there is a broad expectation that after two years of rate hikes, they will now follow the Bank of Canada and the ECB (European Central Bank) on a path of sustained rate cuts. There is some speculation that this rate move would tighten the gap between JPY and USD funding, putting further pressure on carry trade positions.
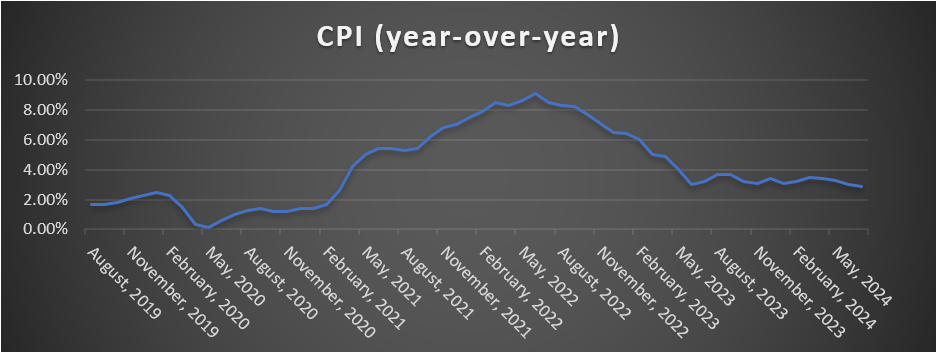
A key focus for the FOMC is published CPI (consumer price index) data, the most referred to measure of this is the year-over-year change CPI index, as shown in the chart above. For the first time since March 2021, year-over-year CPI has tipped into the sub 3% range. While the FOMC are seeking to reanchor inflation at 2%, considerations such as the recent corrections to employment data would support the case for making a rate cut at this time, consistent with speculation that inflation above 2% might be tolerable in the near-term.
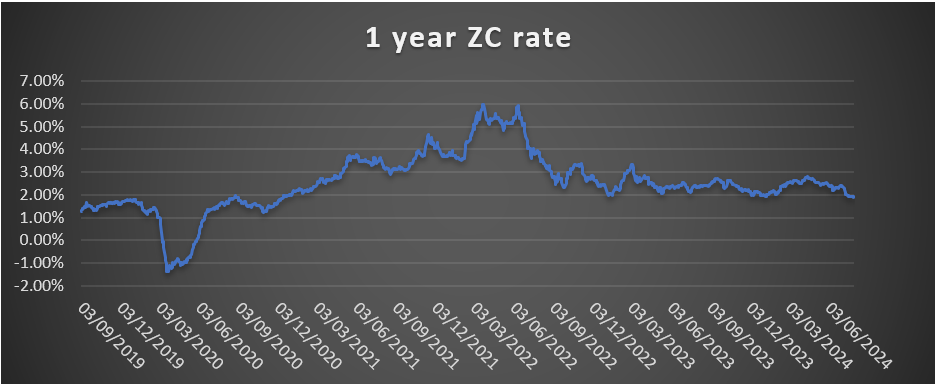
In derivatives markets, zero-coupon inflation swaps referencing US CPI (urban consumer index) are a good indicator of market view on expected inflation and reflect the market view on expected inflation for a given swap term horizon. Thus, if we look at the 1yr US CPI swap quote shown in the chart above, it was largely normalized around 2% prior to the global pandemic, went as low as -1.35% in March 2020 and then was at levels above 6% in both March and June 2022. By Jan 2023, the rate normalized around 2% and is 1.975% as of time of writing. This shows that the market has consistently under-estimated inflation for the last 18 months, but expresses confidence in the FOMC anchoring inflation back to 2% in the near term.
Coping with the Impacts
Pivots in central bank policy or shifts in interest rate regimes, whether it be with Japanese monetary policies or with monetary policies in Western countries, are significant especially in the increasingly interconnected and correlated post-pandemic market. How then should marker players cope? An important piece of the puzzle is having the means to track market views in real time. This is critical not just for validating investment ideas but also for accurately managing positions, where valuation and risk exposures in the context of scenario analysis can be tracked and monitored. Particularly on event days, having a real time view of data is invaluable, and can empower market players in the following key ways:
Controls, visibility, and flexibility in place
- Validating models to the latest market data
- Projecting market curves from the latest market data
- Adjusting calibration strategies
- Assessing position impact analysis for a range of scenarios
Identifying potential opportunities
- trading inflation linked instruments
- analyzing forward interest rate swap par rates
- evaluating potential impacts to the fixed income market
- identifying opportunities in FX options trading
- gauging zero-days-to expiry (0DTE) options
- seeking mispricing opportunities in the equity market using options and swaps in equities, indices or in mixed dispersion trades
Get a Deeper Dive into this Topic...
Watch my new video, where I take a close look at recent events surrounding the Bank of Japan rate hike, including what the current market data shows. I also demonstrate how to quickly and easily adapt FINCAD Analytics Suite from Numerix, the powerful yet easy-to-use derivatives analytics library that enables users to gain an accurate market view and identify potential opportunities.