
Market turbulence in the last two months has left many wondering, "What's next?" We've seen indicators of the economy trending poorly, such as high unemployment, continued infection rates, and potential supply chain disruption. Meanwhile the markets themselves have remarkably bounced back to modest declines over the last three weeks. To better understand the markets in uncertain times, it is useful to look at implied variance.
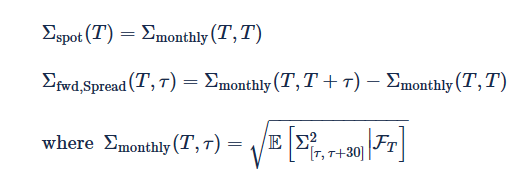
In my last blog I talked about the use of short-vega option strategies and variance swaps in order to take positions or hedge against a decay in implied volatility. We can look at the break-even vol strike for monthly variance swaps, both spot-starting and forward-starting, to learn more about the impact on the current trends and outlook for equity markets. To do this I calibrated FINCAD analytics to the S&P 500 every day over the last two months, and calculated the spot monthly volatility and the forward monthly volatility spread for ττ ranging from 30 to 150 days in the future:
 After calculating these curves shown below, I could immediately recognize some interesting patterns in the implied vol markets over the last two months. The first signs of the current pandemic hit the US stock markets in the second-half of February, and it is interesting to note that the longer-dated forward monthly vol spread started to go negative around this time. This was interesting as an indication of short-term volatility, together with the expectation for a decrease in volatility as time moved on.
As volatility picked up, exacerbated by the rapid decline in oil prices, the forward vol spread continued to sink, indicating an increased expectation of short-term vol. But the expectation of increased vol also began to span a longer time-horizon, as the 1m-2m forward vol spread hit peak levels of 20% concurrently with the US fed’s drastic rate-cutting announcements. By mid-March it was expected that the current course would lead to prolonged market volatility above 50% over the next 60 days.
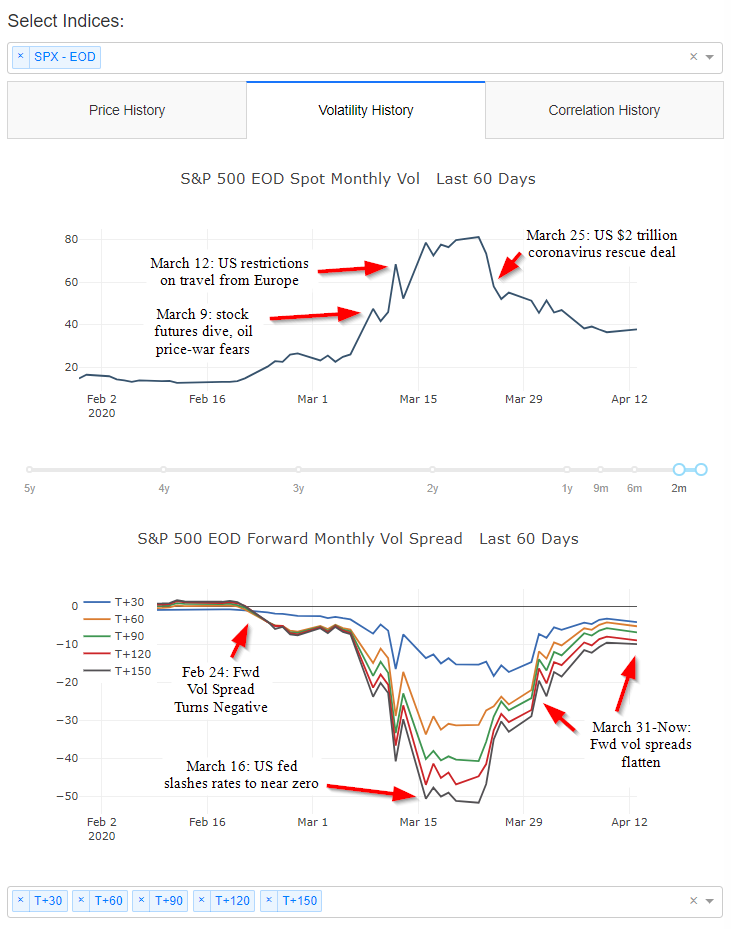
However, that expectation of long-term volatility was not realized, with a major factor being the increased level of intervention taken by the US fed in the open markets. Notably since the passing of the $2 trillion stimulus package on March 25, vol levels have reduced and stabilized around 40%. As I discussed in my previous post, this would have benefited anyone with recent short-vega positions. In addition, the forward vol spread has continued to decrease, while remaining negative, indicating the current outlook is for long-term and slowly-decreasing volatility term structure.
Returning to the technical strategies which could be used in this environment, now that spot vol has stabilized and forward vol term structure has flattened, it is intriguing to consider the possible impact of additional waves of the pandemic, or conversely any potential news around the possibility of an effective treatment and economic recovery down the road.
Among the variance derivatives that I introduced last time are a few more exotic types of variance derivatives, which include corridor variance swaps. Due to the theoretical replication of variance swaps with a portfolio of OTM calls and puts, corridor variance can be intuitively understood as a long variance swap and short OTM calls and puts corresponding with the corridor level. This is roughly similar to vertical spreads, which means there is skew risk for corridor variance swaps. A more exotic version of this trade also includes knockout conditions, which typically hedge structured products with similar conditions. While knock-out variance swaps are attractive for their reduced cost basis, they introduce model-dependent forward skew risk and generally require more sophisticated modeling.
While it is not pictured, I did observe a gradual increase in the 90-100 skew for the S&P 500 from around 0.7 to 1 vega over the last two months, which may be more typical of a high-downside volatility expectation. Given that many variance products are structured to swap vega from less liquid underlyings, there could be some opportunities as well to position around relative skew changes in certain assets in a strategy that only requires vega hedging the more liquid indices.
Whatever your approach to the current markets, there seems to currently be an expectation of significant realized volatility in the future. Thus, it is important to understand your vega risk as well as some of the vega and skew-sensitive strategies, including variance swaps. I found the above analysis useful in shedding light on recent events around implied volatility. It demonstrates the importance of ensuring your market view of volatility is as complete as possible in these rapidly changing and turbulent times.